Inside Go – Part 3: Garbage Collection

In the second part of this series, we explored how Go manages memory between the stack and the heap, and how developers can influence where allocations land. That was our foundation to understand why memory management matters for performance and correctness. If you have not read it yet, you can check out Part 2 using the link below.

The story so far: from full stops to smooth cruising
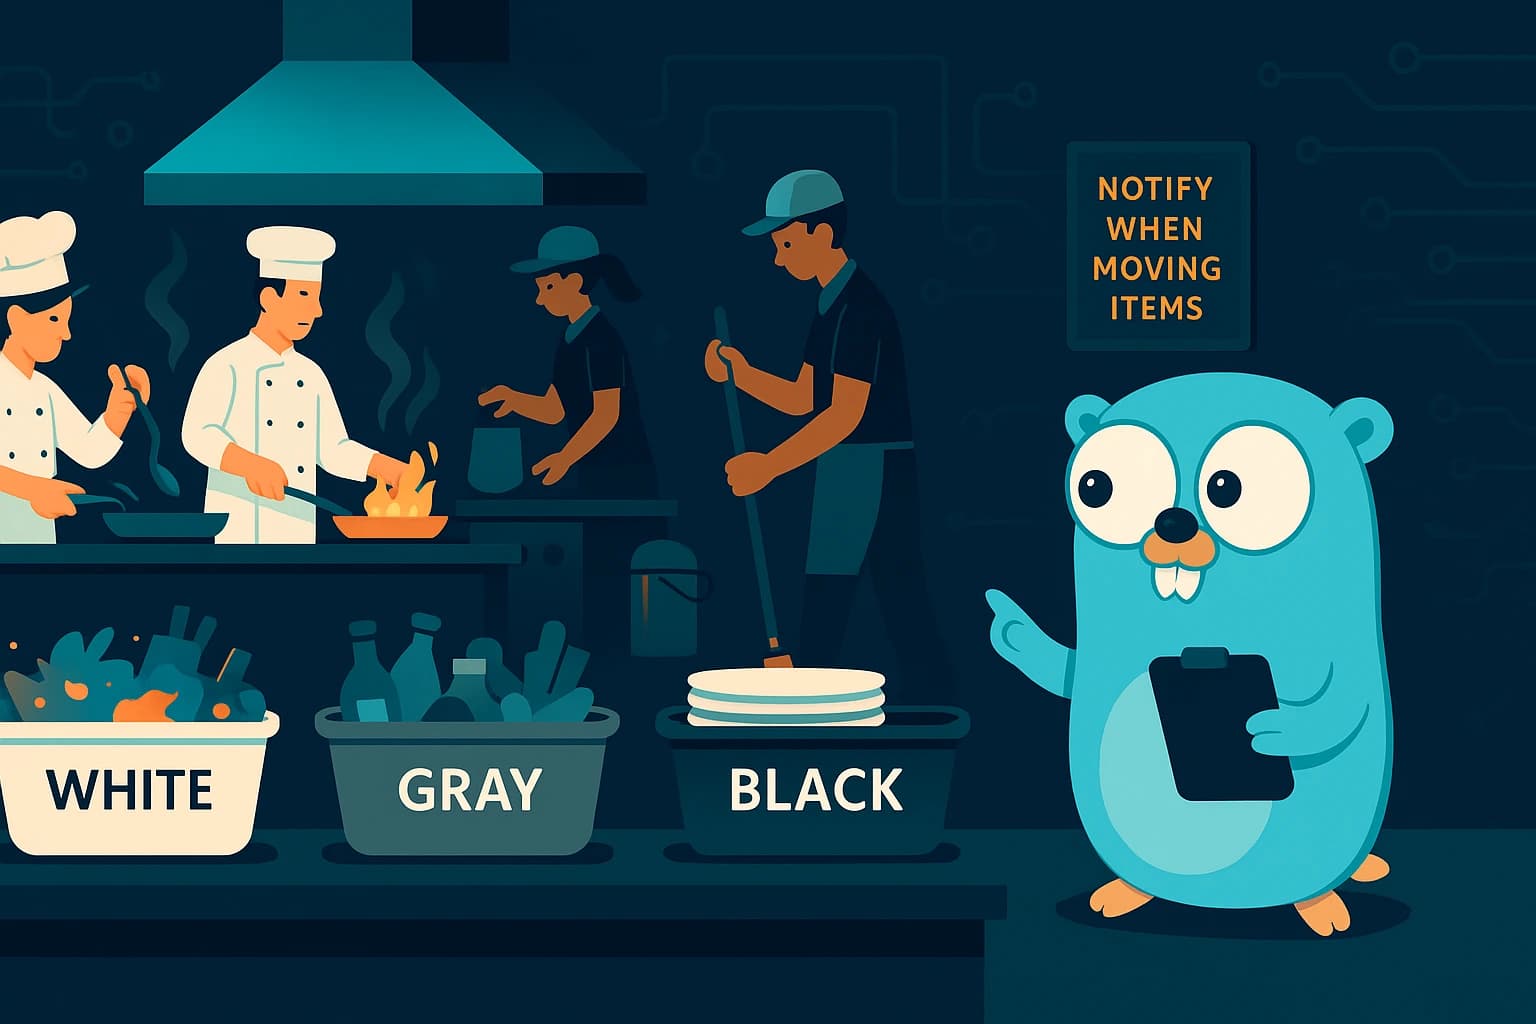
Think of a busy restaurant kitchen. Early on, every hour the head chef shouted "Stop" so the whole crew could clean the counters. Fast, but everything paused. Over time, the team learned to clean while cooking. Now the chef only pauses briefly to sync or to do a quick safety check, while most cleaning happens alongside the cooking.
That is roughly Go’s evolution. In the early days, garbage collection meant noticeable stop-the-world pauses where the program froze so the runtime could find and free unused memory. Starting with Go 1.5, the collector shifted to a concurrent tri-color mark-sweep design, allowing most of the work to happen while the program kept running and reducing pauses to very short coordination points. Later improvements, such as the hybrid write barrier introduced in Go 1.8, pushed pause times down even further, often to the point where they are only a fraction of a millisecond in real-world workloads.
Tri-color marking explained
Imagine sorting clothes after a trip. You use three baskets with different colors:
- White: unknown items that may be dirty (not checked yet).
- Gray: items you are inspecting now (discovered and being checked now).
- Black: confirmed clean items (fully checked).
Begin with all clothes in the white basket. Take the roots you can reach immediately (the jacket in your hand, the items on top) and move them from white to gray. While the gray basket is not empty, pick one item. As you check it, if you find related pieces it points to (the matching sock, the belt for the jacket) and they are still white, move those from white to gray. When you finish checking the current item, move it to black. When there are no gray items left, anything still white was never reached and can be discarded.
That is tri-color marking: mark reachable objects by walking pointers from roots, then sweep the rest. Go’s GC does this mostly while your program runs, which is why we care about the next concept.
Why write barriers exist and how the hybrid one helps
During the mark phase, Go’s GC walks pointers to find what is still reachable. Your code is running at the same time and can create new pointers or change existing ones. If the GC has already scanned some object and then your code adds a new pointer from that object to something the GC has not seen yet, the collector could miss that new edge. Missing it would mean freeing memory that is still in use, which would be a disaster.
Consider that you are auditing a warehouse to decide which boxes must go on the truck. "Must go on the truck"means the box (an object in memory) is still needed and should stay in memory.
- The auditor (the GC marker that reads lists) checks Box A early and finishes with it. A is now considered black.
- Box B has not been discovered yet. B is white.
- A worker updates A’s list: "A points to B". The auditor does not know about this new link, because A was already checked.
- B might never be visited and could be left off the truck. That would be like freeing memory that is still in use.
The rule that fixes it (the write barrier)
Whenever a worker adds a new entry saying "A points to B", they must alert the auditor immediately. The auditor then tags B gray so it will be inspected soon. This guarantees B is not missed.
Go’s hybrid write barrier combines the classic insertion and deletion styles so the runtime does not need a heavy re-scan at the end. In practice it:
- Marks certain newly created objects as already seen, so they cannot be missed.
- Ensures that when a pointer field is updated during marking, the referenced object is recorded for the GC’s gray worklist.
This keeps the tri-color invariant safe while the program mutates pointers, and it keeps pauses short.
Tuning GC with GOGC: finding your balance
GOGC controls how much the heap is allowed to grow between collections. The default is 100, which means "start a collection when the live heap has roughly doubled since the last cycle". You can set it as an environment variable or change it at runtime via debug.SetGCPercent. Lower values collect more often and keep memory tighter at the cost of more CPU. Higher values collect less often, which can improve throughput but grow memory. Setting GOGC=off disables GC which is rarely what you want in production.
GOGC is like deciding how full the street bins can get before calling the truck. If you call it at 50 percent fullness, your street stays tidy but the truck burns more fuel. If you wait until 200 percent fullness, pickups are rare and cheap, but the street looks messy and bins can overflow.
Trade-offs to remember
- Lower GOGC -> lower peak memory, higher GC CPU, possibly lower latency spikes, sometimes lower throughput.
- Higher GOGC -> higher peak memory, fewer GC cycles, often higher throughput, but risk of hitting memory limits.
The official GC Guide [⤴] has more nuance on pacing and what counts as the live heap, which helps when you profile a real service.
A tiny program to stress GC and try tuning
Create main.go:
package main

import "time"

func main() {
	// Keep a small fraction of objects so we have both live and garbage
	keep := make([][]byte, 0, 1000)

	stop := time.Now().Add(8 * time.Second)
	for time.Now().Before(stop) {
		for i := 0; i < 50_000; i++ {
			b := make([]byte, 8*1024) // allocate 8 KB-sized blobs

			// Keep every 10,000th allocation so the heap has roots
			if i%10_000 == 0 {
				keep = append(keep, b)
			}
		}

		time.Sleep(10 * time.Millisecond) // Small pause to yield
	}

	println("kept objects:", len(keep))
}
Run a few experiments with GC tracing enabled:
1. Default behavior
GODEBUG=gctrace=1 go run main.goWhat you will see: Several GC cycles with short pauses and a steady heap pattern that settles. Heap will grow between cycles, then drop after sweep. The number of cycles depends on how fast your loop allocates.
How to interpret:
- Expect moderate cycle count and modest peak heap.
- Pause components should be small. If single pauses are large, check for huge objects or long stop phases.
- The goal will track above the live heap and guides when the next cycle starts.
2. Tighter memory, more GC work
GOGC=50 GODEBUG=gctrace=1 go run main.goWhat you will see: More GC cycles than default. Each cycle occurs sooner because the heap is allowed to grow less. Peak heap numbers shrink.
How to interpret:
- Higher cycle frequency is normal.
- Total GC CPU increases. You may see the cumulative percent near the start of each line creep up.
- Good when memory is tight, but check throughput. If the program slows, you might be over-collecting.
Rule of thumb: Lower GOGC saves memory but costs more CPU. Use when RSS limits or container memory budgets matter.
3. Looser memory, fewer collections
GOGC=400 GODEBUG=gctrace=1 go run main.goWhat you will see: Fewer GC cycles. Heap grows larger between collections. Pauses remain short, but there are fewer of them.
How to interpret:
- Peak heap increases. Watch X->Y->Z MB numbers.
- If you have headroom, throughput can improve because the runtime spends less time collecting.
- If memory constraints are strict, this can push you into swapping or OOM (Out Of Memory).
Rule of thumb: Higher GOGC improves throughput at the cost of more memory. Use when latency is fine and memory is plentiful.
4. GC disabled for curiosity
GOGC=off go run main.goWhat you will see: No gctrace lines, and the process memory climbs during the run.
How to interpret:
- Useful as a contrast to see how much GC was doing.
- Not for production. Memory will keep growing as garbage is never reclaimed.
Safety tip: Use this only for experiments. It helps quantify how much memory the program allocates if nothing collects it.
Reading "gctrace" at a glance
When you run with GODEBUG=gctrace=1, you will see lines like:
gc 12 @5.3s 2%: 0.2+1.0+0.1 ms clock, 1.2+0.3/0.7/0.0+0.2 ms cpu, 8->5->3 MB, 10 MB goal, 4 PHow to read this, piece by piece:
- gc 12: the GC cycle number.
- @5.3s: time since program start when this cycle finished.
- 2%: percent of time spent in GC since program start.
- 0.2+1.0+0.1 ms clock: wall time split into short stop phases plus concurrent work. Roughly: small stop, concurrent mark, small stop.
- 1.2+0.3/0.7/0.0+0.2 ms cpu: CPU time across helpers. Format can vary by version. Think of it as time from background workers, assists, sweep, and small stops.
- 8->5->3 MB: heap at start of cycle, heap after mark, heap after sweep.
- 10 MB goal: the heap target that pacing aimed for.
- 4 P: number of logical processors used by the scheduler.
Numbers vary by Go version, but the ideas above hold. Focus on cycles, pauses, heap sizes, and the goal.
Quick checklist while you compare runs
- Cycle count: increases as GOGC goes down.
- Peak heap: decreases as GOGC goes down.
- Pause time: should stay short in all cases. If not, inspect large objects or spikes in allocation rate.
- Goal tracking: the goal should make sense with your GOGC choice. Lower GOGC means a lower goal and earlier cycles.
Wrap-up
Go’s garbage collector is the safety net that lets us write clear code without manual free calls or complex ownership rules. It finds unreachable objects, reclaims their memory, and does most of this while the program keeps running. The result is simpler code and a steady service that does not stall for long pauses.
In day-to-day work you usually do nothing. Ship with the defaults, measure with pprof, and only tune when data says you should.
If you are curious about the other topics I cover in this series, you can check out the introduction post using the link below.
